People Analytics: Insights from Employee Data
- SUCCESS KINGSLEY
- Jul 23, 2024
- 4 min read

Tools used: Google Sheet, Microsoft Excel, PostgreSQL, Looker Data Studio and Powerbi.

Introduction:
Data analytics is important in every sector, including Human Resources.
Data analytics in Human Resources, also called People Analytics, helps us determine not only the impacts of employees on the business but also the impact the business has on its employees.
By leveraging People Analytics, organizations can create a more resilient and sustainable corporate environment. This approach not only drives business success but also ensures that the company is a responsible and attractive employer, committed to the well-being of its employees and the broader community.
Objectives:
The primary objective of this HR Analytics project is to provide a comprehensive understanding of the workforce dynamics, including onboarding and exit trends, employee demographics, length of service, and absenteeism. By achieving these objectives, an organization can enhance its HR strategies, promote a diverse and inclusive work environment, and improve overall employee satisfaction and retention.
Data Source
Data was gotten from Kaggle and Transformed with both Google Sheet and MS Excel.
Methodology
I started by loading the employee data into a PostgreSQL database. The data was then processed using a series of SQL queries to extract insights on demographics, turnover, absenteeism, diversity, and engagement. The results were visualized in Powerbi to create interactive and insightful dashboards.
The next step involved utilizing data that was already in a Google Sheet, as it was a collaborative dataset. Instead of loading this data into PostgreSQL, I opted for a more straightforward approach by linking it directly to Looker Data Studio. This allowed for efficient visualization of the onboarding and exit information.
The insights derived from the data were then shared via a PowerPoint presentation, which included actionable points for further analysis and decision-making.
SQL Query
SQL was used to extract insights on the Active employees in the company . The insights extracted were gender distribution, Age distribution, Length of Service, Absenteeism rate and correlation between Length of Service and Absenteeism. The insights gotten were downloaded in different sheets in an MS Excel workbook and linked to Power Bi.
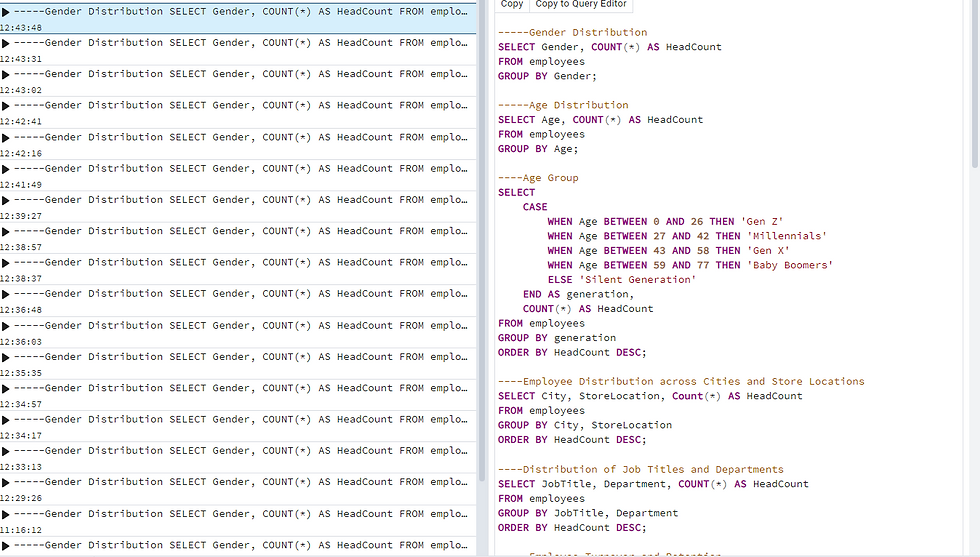
Fig i: Snippet of SQL queries in PostgreSql
Full code is available on request.
Google Sheet
Onboarded and Exited Employees data was already made available in google sheet. Cleaning was done with google sheet and It was linked to Looker Data Studio for insights.
Results/ Visualization (Power Bi)
Showing Active Employees, Service years and Absenteeism.

Fig ii: Age and Gender Distribution
Insights
The gender distribution is fairly balanced with 50.58% of the distribution and 49.42% female.
Majority of employees are Millennials. Most
employees fall within the 25-45 age range, indicating a youthful workforce which could be beneficial for innovation and adaptability.
There is a fairly even distribution of genders across most job titles, although roles like Dairy Person and Produce Clerk show a higher proportion of male employees.

Fig iii: Service years distribution
Insights
Mendez Linda has served the company the longest and should be rewarded in a way alongside the top 19 employees with highest service years.
Employees tend to leave the processing "meats, processed foods, dairy etc." departments more and may not get to move to managerial roles.
The Human Resources units have longer average service years compared to other departments indicating potential stability and lower turnover at the corporate level while Stores have shorter service years.

Fig iv: Absenteeism and Service years.
Link to interact with the Powerbi Dashboard is available on request.
Insights
There appears to be a negative correlation where employees with longer service years tend to have lower absenteeism, suggesting experienced employees may be more committed or have better job satisfaction compared to employees with lesser service years.
Dairy Manager role have high absenteeism rates with mostly lower service years, which is point of concern. This position may have higher stress levels or other contributing factors to absenteeism and resignation.
The Human Resources units have longer average service years compared to other departments indicating potential stability and lower turnover at the corporate level while Stores have shorter service years.
Departments like 'Processed Foods' and 'Customer Service' have the highest average absent hours, which might indicate areas needing targeted wellness programs or workload assessments.
Results/ Visualization (Looker Data Studio)
Showing Employees Onboarded in the 1st Quarter and Employees Exited in the 1st Quarter.

Fig v: Onboarded Employees in the first quarter.
Link to interact with the Looker Data Studio Dashboard is available on request.
Insights
There is a steady onboarding trend with some fluctuations, suggesting periodic hiring drives or seasonal employment trends.
There was a significant drop in July 2024 with only 53 new hires, indicating a possible slowdown in recruitment.
A balanced gender distribution indicating a positive gender diversity within the organization, supporting inclusivity and equality.
The majority of onboarded employees are from Gen Z (62.7%) and Millennials (35.7%) indicates a young workforce, which can drive innovation and adapt quickly to changes.
Most onboarding occurred at the P0 job grade (425), indicating entry-level positions being filled.
Higher job grades (P5, P6) have fewer onboardings, suggesting selective hiring for senior positions.

Fig vi: Exited Employees in the first quarter.
Link to interact with the Looker Data Studio Dashboard is available on request.
Insights
The total number of exited employees over the reviewed period is 940.
The exit trend shows variability, with the highest exits in July 2024 (167).
July has recorded more exit and lesser onboarding which is a point of concern with more of the attrition type being Resignation.
Most exits are due to resignations (154 in July 2024), with a smaller proportion due to terminations.
The gender distribution of exited employees is slightly male-dominated with 53.3% male and 46.7% female.
This balance suggests no significant gender bias in exits.
Data Presentation
Data presentation is conducted using PowerPoint. Insights are shared through charts, each of which is accompanied by a link allowing interaction with the individual charts. These charts are inserted individually into the presentation.
Conclusion:
This analysis provides a comprehensive overview of employee demographics, turnover, absenteeism, diversity, and engagement. The insights derived can help HR teams make data-driven decisions to improve employee satisfaction and organizational performance. By leveraging People Analytics, organizations can support corporate sustainability through enhanced well-being, diversity, efficient resource allocation, and strategic decision-making.
Recommendations:
Implement targeted retention strategies for departments with high turnover.
Enhance employee wellness programs to reduce absenteeism.
Promote diversity initiatives to maintain balanced gender representation.
Exit interviews for resigned employees can help address employee satisfaction and retention.


Comments